
You’ve now seen two ways of judging whether or not a sample mean is likely or unlikely. The first is by looking at where the sample mean falls on the sampling distribution in relation to the population mean. The second is by looking at the confidence interval (typically a 95% CI) for the true population mean if everyone were to have that intervention (μI), and see if the original population mean falls in this range.
In this lesson, we’ll focus again on the first method—where a sample mean falls on the sampling distribution—and formalize the procedure of deciding whether or not this sample mean is likely or unlikely. We do this by finding the p-value, which is the probability of obtaining that sample mean.
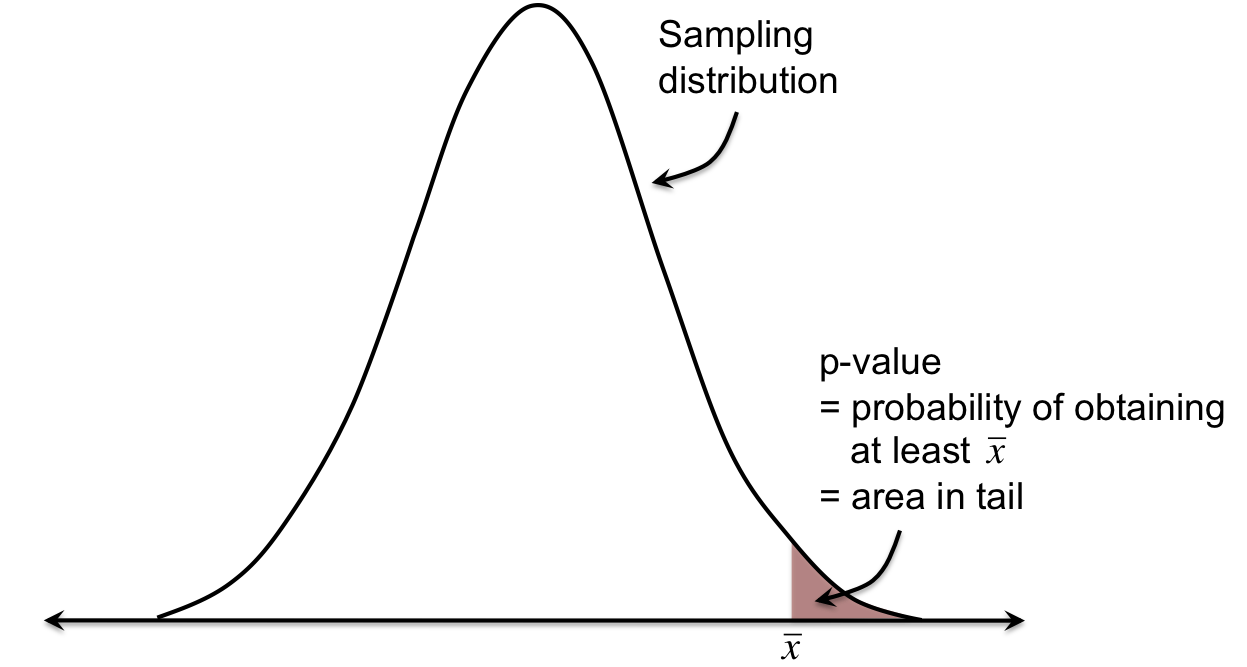

Oftentimes, we decide that a sample mean is significantly unlikely if the p-value is less than 0.05 (called our alpha level, or significance level). Let’s do an example.
This is a preview of Lesson 9. To access the full book, please purchase a hard copy or a digital version. If you opt for the digital version, you will receive a link via email within 1 business day.
Continue to Lesson 10, or select a lesson below.
Lesson 1: Introduction to Statistical Research Methods
Lesson 2: Visualizing Data
Lesson 3: Central Tendency
Lesson 4: Variability
Lesson 5: Standardizing
Lesson 6: Normal Distribution
Lesson 7: Sampling Distributions
Lesson 8: Estimation
Lesson 9: Hypothesis Testing
Lesson 10: t-Tests for Dependent Samples
Lesson 11: t-Tests for Independent Samples
Lesson 12: Intro to One-Way ANOVA
Lesson 13: One-Way ANOVA: Test significance of differences
Lesson 14: Correlation
Lesson 15: Linear Regression
Lesson 16: Chi-Squared Tests
Afterward
Index