
Let’s say we apply some kind of intervention to a sample, and then find that the mean of this sample is x̅I(“I” for “intervention”). Could we use this to estimate the population parameters if everyone were to receive the same intervention?
We could guess that the new population mean, which we’ll call μI, would be somewhere around x̅I. From the limited information we have, the sample mean is our best estimate for the new population mean. We call this a point estimate since it’s a single value rather than a range of values.
Actually, a range of values is exactly what we want. In this lesson, we’ll calculate confidence intervals for where μI might be; in other words, we’ll be fairly confident that μI is between two particular values. We’ll determine what these values should be.
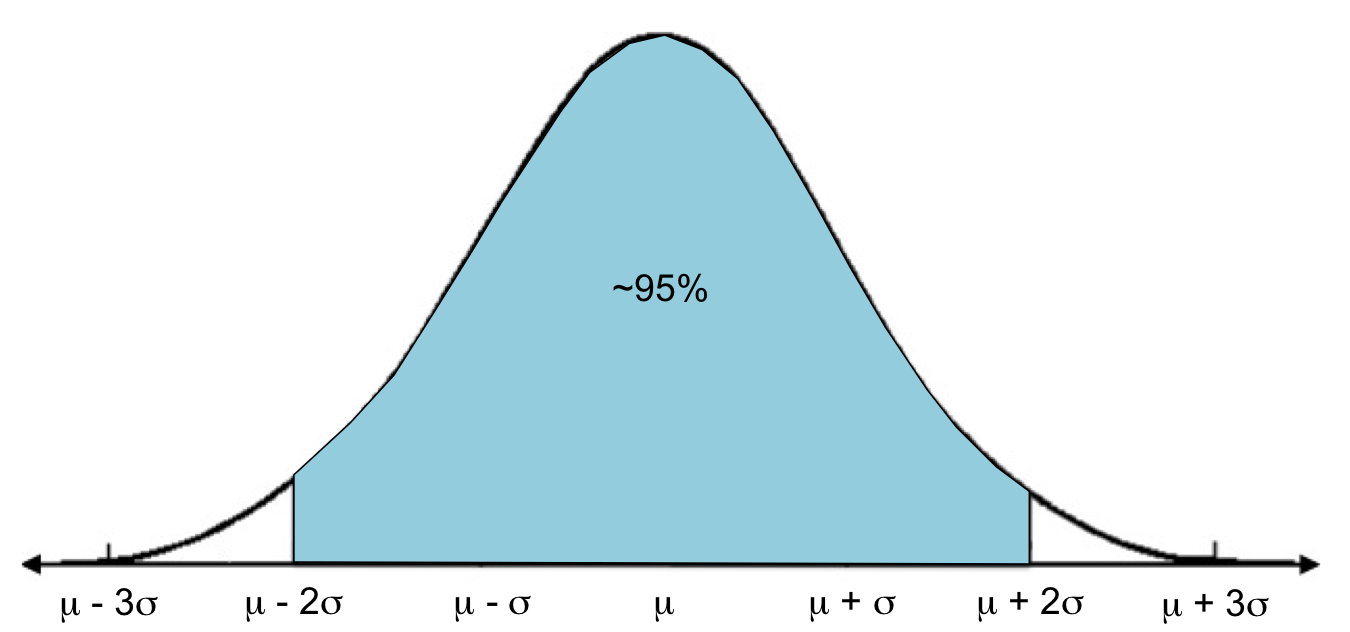
In Lesson 6 you learned that for a normal distribution, most values (about 95%) are within two standard deviations of the mean.
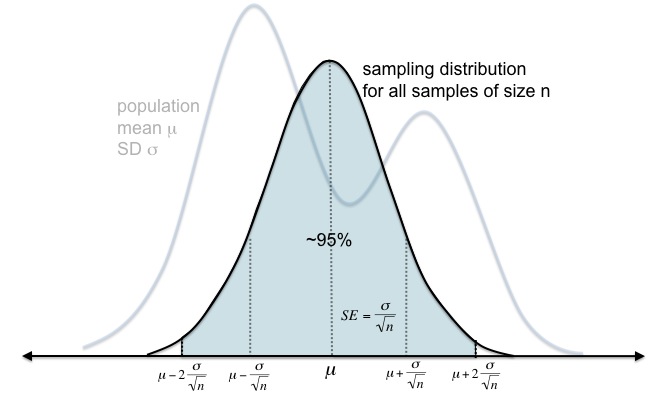
We can extend this concept to sampling distributions: approximately 95% of sample means will fall within 2σ/√n of the population mean.
This is a preview of Lesson 8. To access the full book, please purchase a hard copy or a digital version. If you opt for the digital version, you will receive a link via email within 1 business day.
Continue to Lesson 9, or select a lesson below.
Lesson 1: Introduction to Statistical Research Methods
Lesson 2: Visualizing Data
Lesson 3: Central Tendency
Lesson 4: Variability
Lesson 5: Standardizing
Lesson 6: Normal Distribution
Lesson 7: Sampling Distributions
Lesson 8: Estimation
Lesson 9: Hypothesis Testing
Lesson 10: t-Tests for Dependent Samples
Lesson 11: t-Tests for Independent Samples
Lesson 12: Intro to One-Way ANOVA
Lesson 13: One-Way ANOVA: Test significance of differences
Lesson 14: Correlation
Lesson 15: Linear Regression
Lesson 16: Chi-Squared Tests
Afterward
Index